Weather systems in Australia, and their impact on crop production
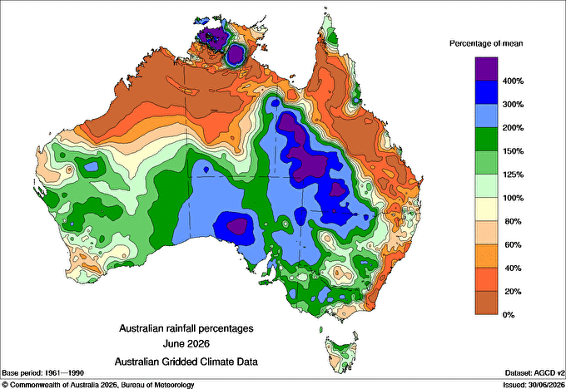
On the whole, Australia has been blessed with three strong years of grain production from 2020 through to 2023. However, after a promising start to the year and with many areas of the country holding good moisture profiles after a wet summer, the last three months have turned dry. Most areas of the national growing belt are experiencing 50+ mm deficits in rainfall for the July to September period. Why the big change and what are the weather patterns driving this current dry spell?
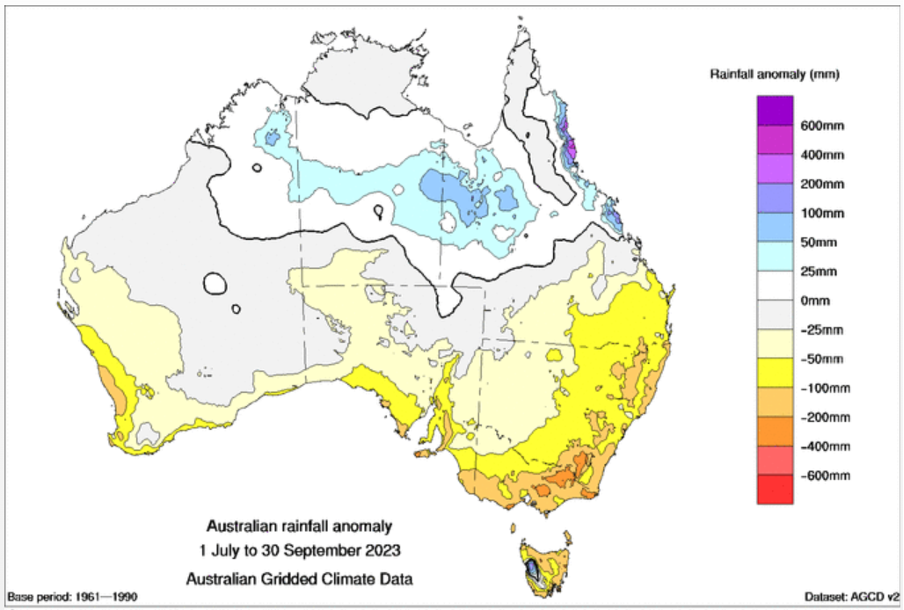
Figure 1 - www.bom.gov.au
Australia’s weather is impacted dramatically by three major weather systems/events; the Southern Oscillation Index (SOI), the Indian Ocean Dipole (IOD) and the Southern Annular Mode (SAM). These weather systems are ultimately driven by the trade winds and sea surface temperatures around Australia and have the greatest impact on rainfall across Australia.
Southern Oscillation Index
The El Nino-Southern Oscillation (ENSO) refers to the movement of rising air in the west, and falling air in the east which is called the Walker Circulation. These trade winds occur across the Pacific Ocean between Australia and Tahiti. There are three phases of SOI; neutral, La Niña, and the phase Australia is currently experiencing, El Niño.
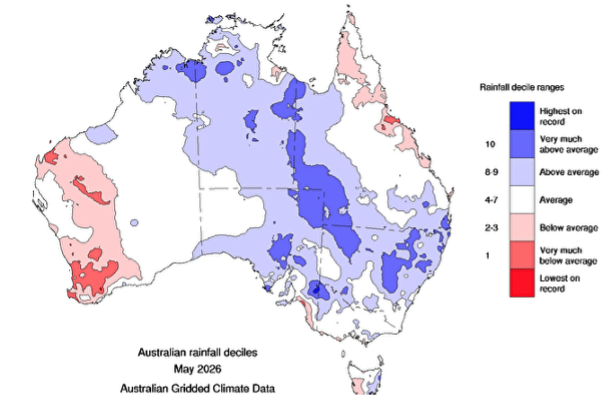
During La Niña, trade winds strengthen, increasing the temperature of the warm water north of Australia. This causes cloudiness and rainfall to increase and typically leads to above average winter and spring rainfall totals across eastern and central parts of the country. From 2020 to the start of 2023 we were largely in a La Niña phase of the ENSO.
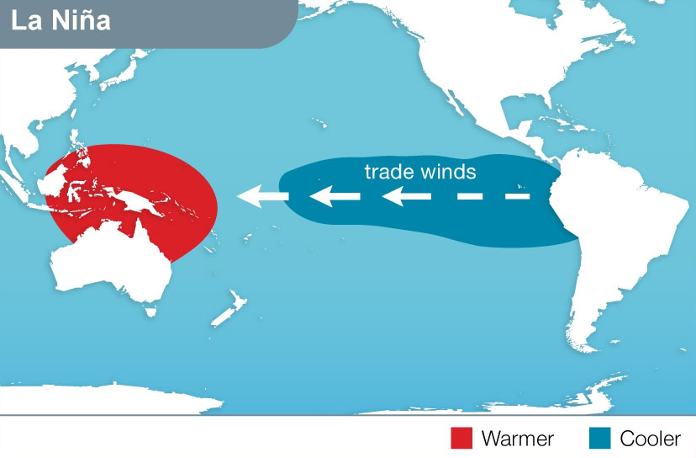
Figure 2- https://agriculture.vic.gov.au/
Alternatively, in the occurrence of an El Niño, trade winds weaken, or may even reverse, seeing warmer waters settle in the Central Pacific. As the usual westerlies stall, cloudiness and rainfall north of Australia are suppressed. This increases the probability of higher temperatures and lower rainfall for northern and eastern Australia. The weather pattern Australia is currently experiencing is El Niño.

Figure 3 - www.bom.gov.au
Indian Ocean Dipole
The Indian Ocean Dipole (IOD) is a climatic phenomenon characterised by the difference in sea surface temperatures between the western and eastern parts of the Indian Ocean. There are two phases of this weather pattern; positive and negative. The phases are determined by where the warmer waters drift. During a positive cycle, warmer waters drift to the west of the Indian Ocean. Under a negative cycle, they drift to the east of the Indian Ocean, south of Indonesia, around the top end of Australia.
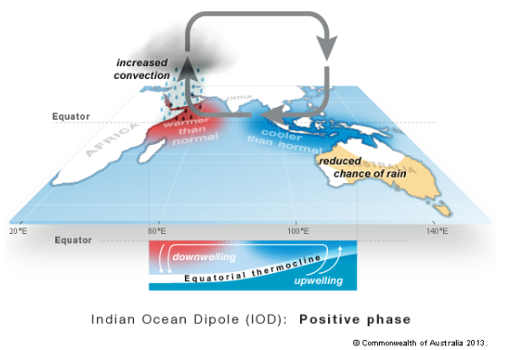
Figure 4 - www.bom.gov.au
In the event of a positive IOD, warmer water settles in the Arabian Sea (Western Indian Ocean), and easterly wind anomalies across the Indian Ocean result in less cloudiness to Australia’s northwest, and less rainfall across the country. We are currently in a positive phase of the IOD
A negative IOD is the opposite, where the warmer waters move east across the Indian Ocean. The winds become more westerly, increasing convection and cloudiness, resulting in more rainfall across the top end and Southern Australia. Recent examples of the negative phase were spring of 2022 and before that, spring of 2016.
The current positive IOD has developed very quickly since July of this year. The event is typically a spring to summer phenomenon with almost all model forecasts calling for it to return to neutral measurements by February 2024.
Southern Annular Mode
Westerly winds in the mid-high latitudes, underneath Australia cause the movement of storms and clouds from Western Australia (WA) into South Australia (SA) and Victoria (VIC). The SAM can influence rainfall events differently depending on the current SOI, working conversely in summer and winter across the positive and negative SAM states.
During the winter, a positive SAM contracts winds towards Antarctica, resulting in weaker westerly winds and higher pressure over SA. This restricts cold fronts inland and leads to lower rainfall in SA, however, sees increased onshore flow for eastern Australia, bringing more rainfall.
During a negative SAM in winter, westerly winds expand northward to the equator, positioned closer to the bottom of Australia, bringing more cold fronts and storm systems to SA. However, the expansion of westerly winds toward Australia, pushes onshore flow away from the East Coast, generally resulting in less rainfall inland for VIC/NSW and along the East Coast.
During the summer, the SAM moves similarly to one in the winter. Westerly winds contract toward Antarctica causing more moist onshore flow from the Tasman and Coral Seas to push inland, leading to increased rainfall along the East Coast, which receives the bulk of Australia’s summer rains. The rain event experienced through northern VIC and southern NSW during the first week of October was during a positive phase of the SAM.
A negative SAM in the summer sees the belt of westerly winds expand toward the equator and Australia, pushing all onshore flow away from the East Coast. These stronger winds lead to less rain in the eastern and southern parts of the country, however, sees an increase in rainfall in Tasmania.
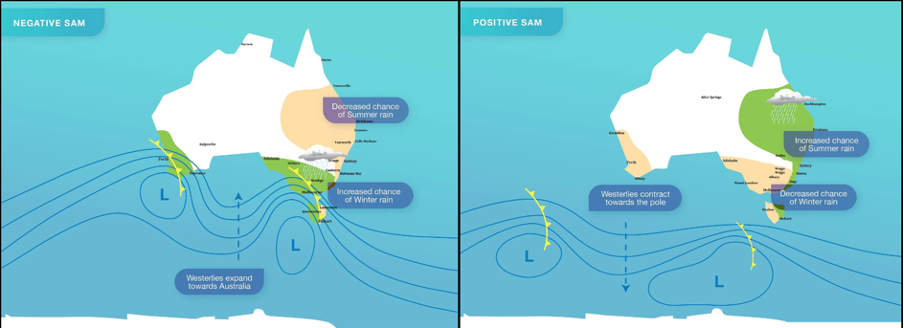
Figure 5 - www.bom.gov.au
The Southern Annular Mode is a weather pattern that is relatively new to be studied. It is also worth noting that its influence on weather patterns usually lasts for one to two weeks as opposed to the ENSO or IOD which are longer term weather patterns.
What does it all mean for Aussie?
The ENSO, IOD and SAM have all been in phases that lead to a higher probability of higher temperatures and lower rainfall for most of Australia’s growing regions. We have all seen this for ourselves as Aussie endures a tougher finish to the season than would be preferred. However, it is worth noting that both the IOD and ENSO formed their current phases very quickly and could dissipate just as quickly. In particular, the IOD is likely to return to neutral by the end of the year. This would improve the flow of north-westerly weather patterns through Australia.
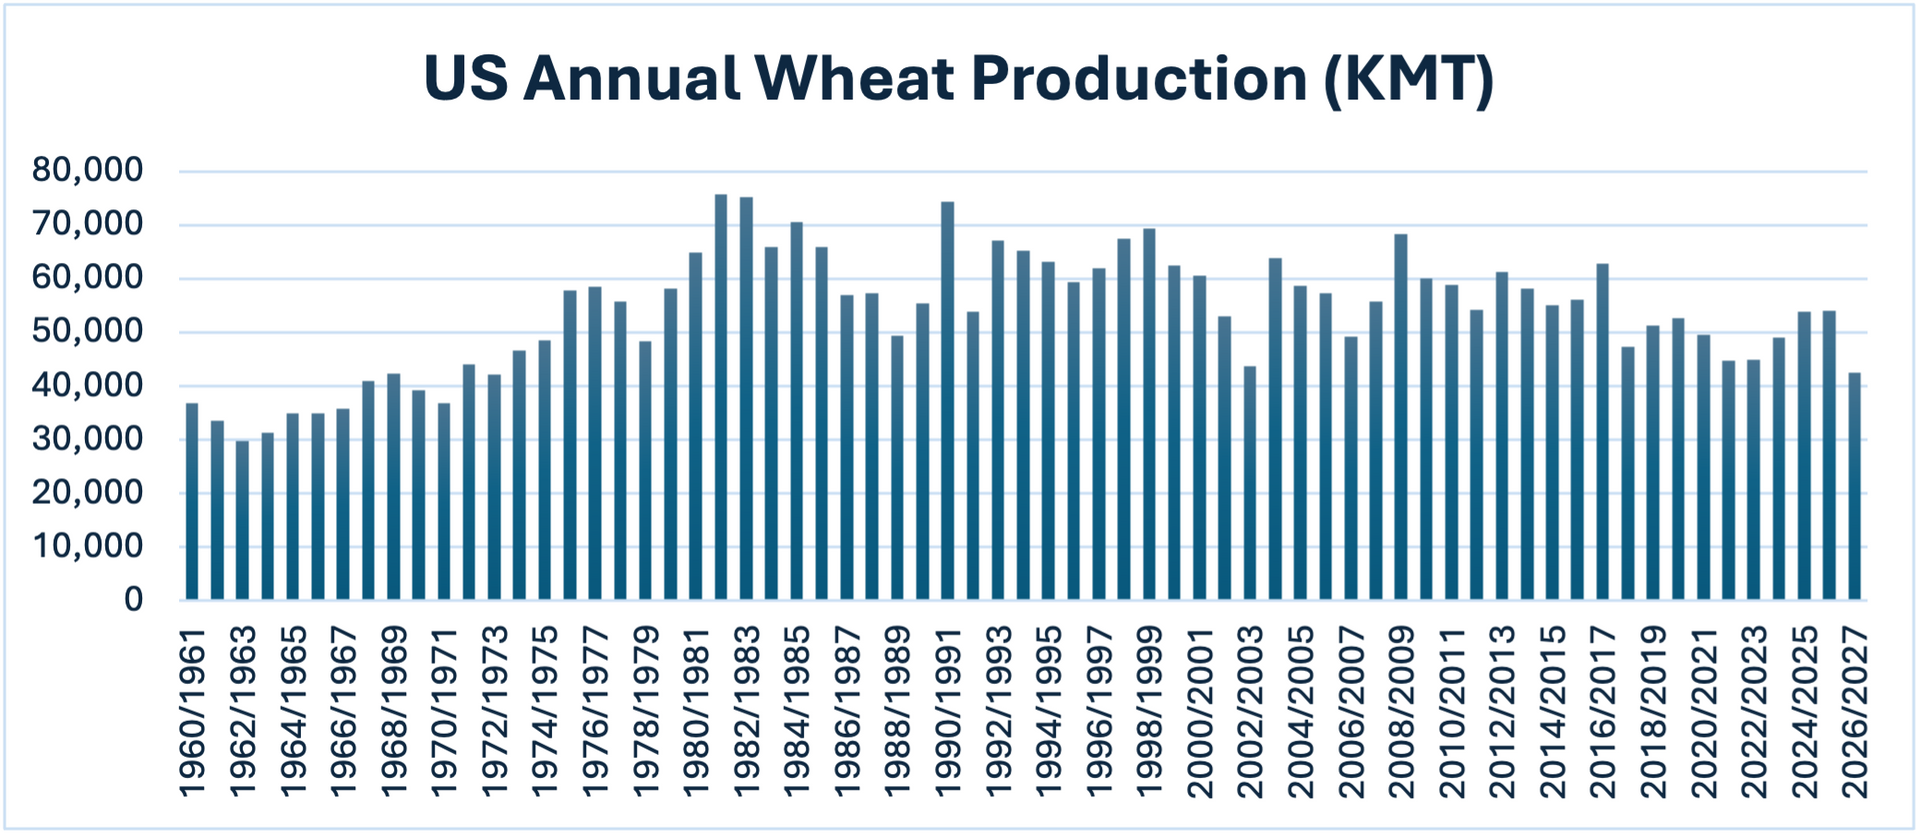
In their most recently updated crop outlook, ABARES is estimating a national wheat crop of 25.4MMT versus 39MMT last season. This would form a drop in wheat production of 35% from last season to the current one.
With ongoing market volatility and further potential impacts from weather related issues as we lead into harvest, utilising Advantage Grain’s dedicated team to manage your grain sales through this period will save you time and could yield real pricing benefits. To see how Advantage Grain’s pools performed last season, visit https://www.advantagegrain.com.au/results
.
Share This Article
Other articles you may like