Local Grain Markets Show Resilience Against Declining International Values.
Activity in grain market influences such as the global economic landscape, domestic export pace, demand and weather, continue to dominate chatter in the industry. However, despite the backdrop of a high interest rate, deflationary environment and declining international grain values, Australian grain markets have shown great resilience over the past month. This is a credit to our record export pace, the expected change to the 2023/24 season climate outlook and increasing cattle on feed numbers as a result of weakening livestock markets.
Record Shipping Pace
Recently released January export data showed that records were made to be broken! Australian grain is flowing out of the country in record volumes creating a solid base of bids for most qualities of wheat, barley and canola in all port zones. Australia exported a record large 3.336MMT of wheat in January up from 2.667MMT in December. This smashed the previous largest monthly wheat exports of 2.765MMT from June 2021. All states had large January wheat exports with SA being the standout with 797KMT shipped, which was almost 50% higher than their December numbers. WA exported 1.14MMT of wheat in Jan, just short of the record 1.157MMT in December.
Investment in road and rail logistics look to be paying dividends as export pathways are running efficiently and without the delays we saw through 2022. As a result, exporters have continued to add volume to the shipping stem for the coming months which should continue to provide a solid bid for those still holding grain.
Changing Weather Patterns
In its latest climate driver update released on March 14, 2023, the Australian Bureau of Meteorology (BOM) reported the La Niña event that brought wet and cool weather patterns to Australia since late 2020 has officially ended. The El Niño–Southern Oscillation (ENSO) is now neutral and expected to stay this way through autumn. In the same update, the BOM also issued an El Niño watch with signs this weather pattern could form later in the year.
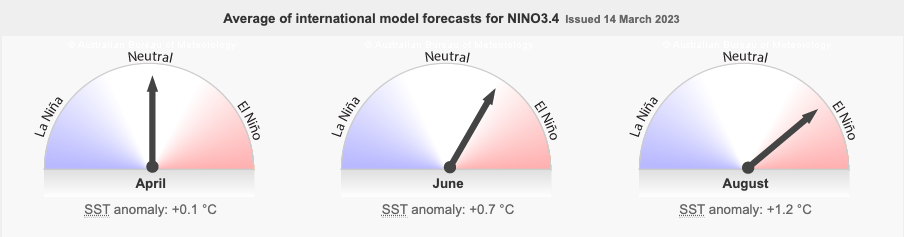
Figure 1: Average of international model forecasts for NINO3.4. Source, http://www.bom.gov.au/climate/enso/
With almost three years of above average rainfall, moisture profiles are still healthy throughout most of Queensland, New South Wales and Victoria. However, the shift in weather predictions will likely change planting intentions over the next few months as farmers keep a close eye on further updates. The drier outlook, although not ideal for finishing crops in the spring, are expected to see price volatility continue as we move through the autumn months and beyond.
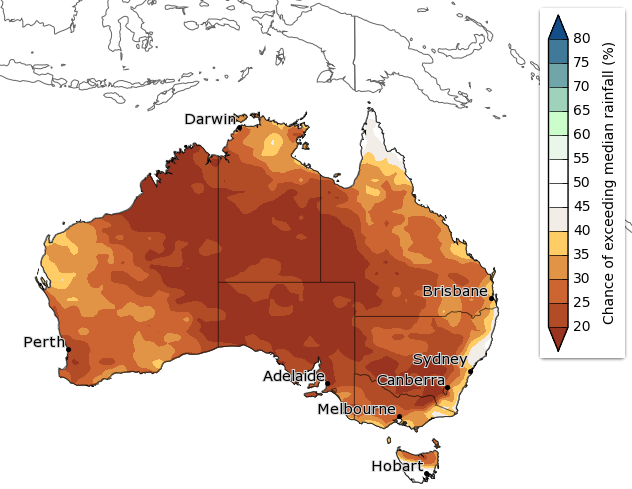
Figure 2: Chance of exceeding median rainfall April to June. Source, http://www.bom.gov.au/climate/outlooks/#/rainfall/median/seasonal/0
Falling Livestock Prices
Over the last five months, Australian livestock prices have seen large falls with sheep and cattle markets coming under pressure.
For the first time since the early months of 2020, when the Australian livestock industry was grappling with a severe, nation-wide drought, the Eastern Young Cattle Indicator has dropped below the 600c/kg mark. Restockers who played a key role in pushing livestock prices to record highs as Australia emerged out of drought, are now slowing restocking rates in the Southern States and reducing herd sizes in the north in line with drier weather predictions.
Meat and Livestock Australia (MLA) sales data from the first week of March showed there was a significant increase in the number of young cattle offered. This included 71% more inventory offered than the same week in 2022, 28% more than the same week in 2021 and 26% more than the same week in 2020.
The buyer breakdown for the same MLA data set showed lotfeeders accounted for 58% of the purchases and restockers/traders accounted for only 34% with processors buying the balance.
This is important for the Australian feed grain demand profile. With cattle on feed numbers on the rise we can expect to see increased volatility in domestic feed grain values.
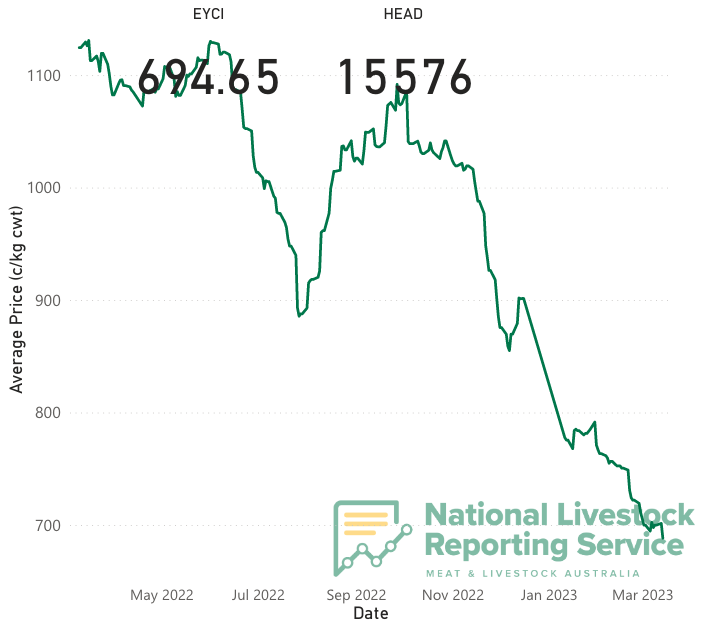
Figure 3: Eastern Young Cattle Indicator, Average Price. Source, https://www.mla.com.au/prices-markets/cattle/eycireport/
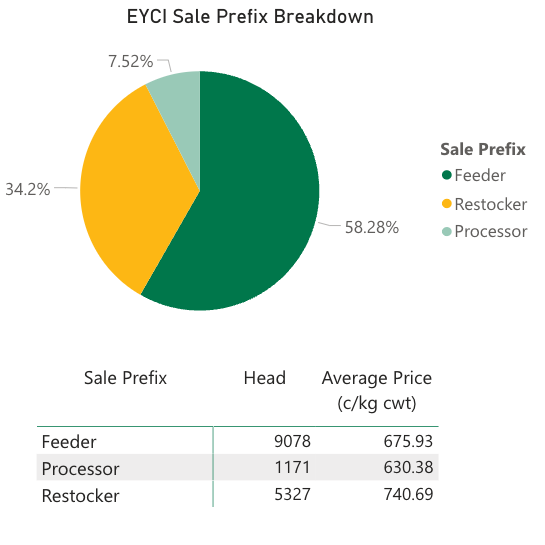
Figure 4: EYCI Sale Prefix Breakdown.
Source,
https://www.mla.com.au/prices-markets/cattle/eycireport/
What does this mean for local grain prices?
Local grain prices are starting to run their own race with domestic pricing influences having a stronger effect than international market drivers, a contrast to what we’ve seen over the past few years. Although the market dynamics have changed, price volatility looks to continue for the short to medium term as strong export demand, local feed demand and a drier outlook create a solid base for Australian grain.
Share This Article
Other articles you may like